Why most /health endpoints lie
A single endpoint returning 200 OK feels like enough — until your app is deadlocked, your database pool is exhausted, or a dependent service is down and you're still serving traffic. The problem isn't health checks themselves; it's treating them as one-size-fits-all.
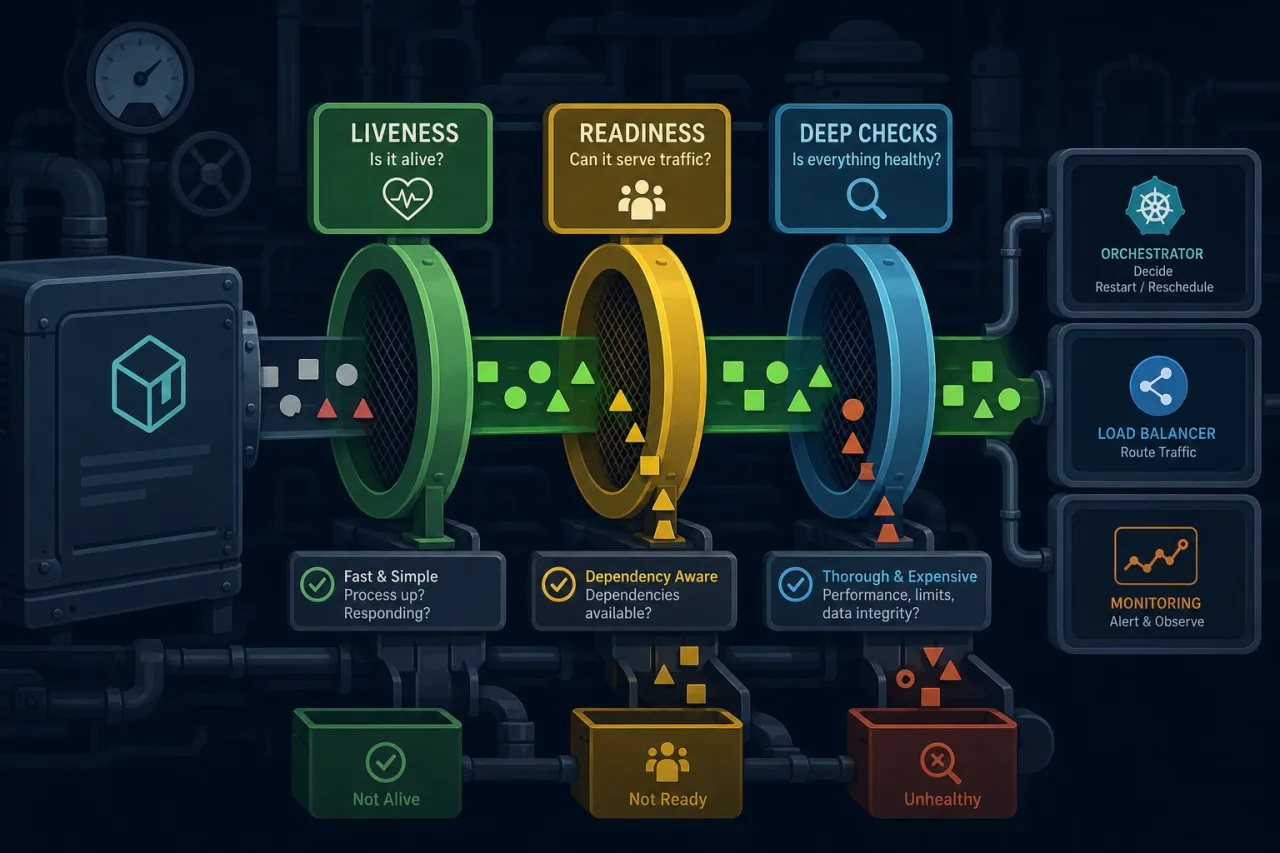
Modern infrastructure separates health into at least three distinct concerns. Getting them right means faster recovery, fewer false positives, and on-call alerts that actually mean something.
Liveness checks
Question answered: Is the process alive and not permanently broken?
A liveness check tells your orchestrator (Kubernetes, Nomad, ECS) whether to restart the container. It should be extremely cheap and reflect only the health of the process itself — not any downstream dependency.
What to check:
- The event loop or thread pool isn't deadlocked
- The process hasn't entered an unrecoverable error state
- Basic in-memory state is sane
What NOT to check:
- Database connectivity
- External API availability
- Cache reachability
If your liveness check queries Postgres and Postgres goes down, Kubernetes will restart every pod in your deployment — which almost certainly makes things worse. Keep liveness checks shallow by design.
A typical liveness response:
{ "status": "ok" }
Return 200 when alive, 5xx when the process should be killed and restarted. That's it.
Readiness checks
Question answered: Is this instance ready to receive traffic?
Readiness is about routing, not restarts. A failing readiness check pulls the instance out of the load balancer rotation without killing the process. This is the right place to check dependencies, because a temporarily unavailable dependency means "don't send me work right now" — not "kill me."
Useful things to verify in a readiness check:
- Database connection pool has available connections
- Required feature flags or config have loaded
- Warm-up tasks (cache priming, model loading) have completed
- Critical downstream services respond within a tight timeout (e.g., 200 ms)
Design notes:
- Use short, hard timeouts on any dependency call. Don't let a slow Redis make your readiness check hang for 30 seconds.
- Return structured JSON with per-dependency status so failures are diagnosable without digging through logs.
- A
503response is the conventional signal for "not ready."
{
  "status": "degraded",
  "checks": {
    "postgres": "ok",
    "redis": "timeout"
  }
}
Deep (diagnostic) checks
Question answered: What is the real internal state of this service right now?
Deep checks are not for orchestrators or load balancers. They're for your monitoring system, your on-call engineer, and your dashboards. Because they're richer and slower, they should never sit on a hot path.
A deep check might include:
- Actual query latency to the primary database
- Queue depth and consumer lag
- External API response times
- Disk and memory pressure
- TLS certificate expiry
- Background job health (last successful run timestamp)
Protect this endpoint. Either put it behind auth or restrict it to internal networks — it exposes operational detail you don't want public.
Polling deep checks from outside your network
This is where external monitoring adds real value. Running deep-check polling from multiple geographic regions (rather than just inside your own datacenter) surfaces problems that internal checks miss: BGP issues, CDN misrouting, region-specific DNS failures. A monitoring service like Pingy can hit your diagnostic endpoint from several locations on a short interval and alert you before users report problems.
A practical implementation checklist
- Create separate routes —
/livez,/readyz, and/healthz(or/debug/health) are common conventions. Never combine them. - Set orchestrator probes correctly — liveness probe →
/livez, readiness probe →/readyz. Review your Kubernetes YAML or ECS task definition. - Cap dependency timeouts — every external call inside a readiness check needs an explicit, short timeout.
- Return machine-readable JSON — structured output lets alerting rules and dashboards parse state without screen-scraping.
- Version your health schema — add a
versionorservicefield so you can correlate responses across deploys. - Test failure modes in staging — kill your database, saturate your thread pool, and verify each check responds as expected.
- Never cache liveness or readiness responses — stale
200 OKresponses from a cache layer are a common source of ghost uptime.
Key takeaways
- Liveness = restart signal. Keep it trivial. No dependencies.
- Readiness = traffic signal. Check dependencies, but with hard timeouts.
- Deep checks = diagnostic signal. Rich, protected, and for humans and monitoring tools — not orchestrators.
- Conflating these three causes real incidents: unnecessary restarts, bad traffic routing, and missed outages.
- External, multi-region polling of your deep check endpoint catches failure modes that internal probes cannot see.