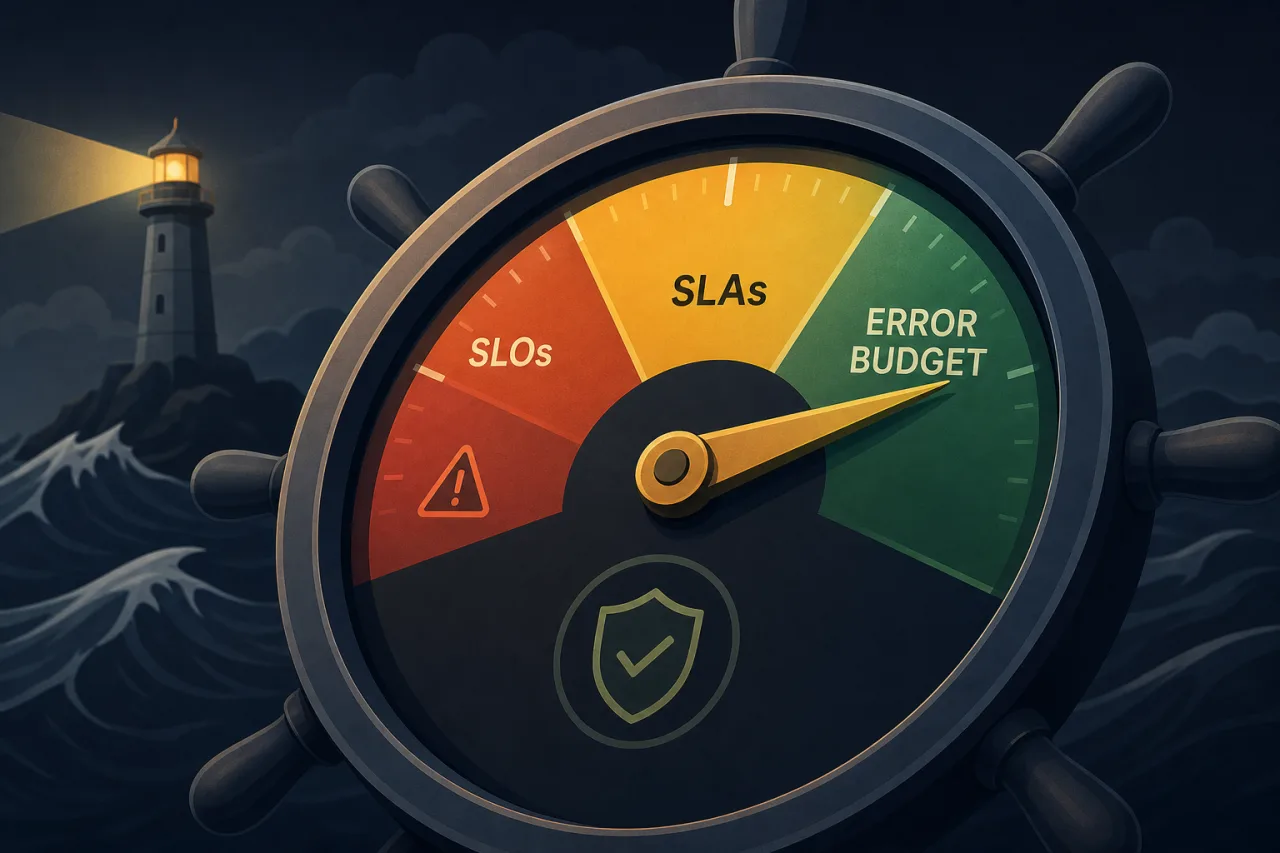
The Difference Between SLO, SLA, and Error Budget
These three terms get conflated constantly. Let's be precise.
- SLI (Service Level Indicator): The raw measurement. Request success rate, p99 latency, uptime percentage.
- SLO (Service Level Objective): Your internal target. "We will serve 99.5% of requests successfully over a rolling 28-day window."
- SLA (Service Level Agreement): A contractual commitment to customers, usually with a financial penalty for breach. Always set lower than your SLO—never equal to it.
- Error budget: The inverse of your SLO. A 99.5% SLO gives you 0.5% of requests—or roughly 3.6 hours per month—that can fail without breaching your objective.
The gap between your SLO and your SLA is your safety margin. If your SLO is 99.5% and your SLA is 99%, you have room to miss your internal target without triggering customer refunds.
Why "Five Nines" Is Usually Wrong for You
99.999% uptime allows roughly 26 seconds of downtime per month. Achieving that demands redundant everything: multi-region deployments, zero-downtime deploys, instant failover. Most teams don't have that architecture.
Start by asking: what does your system actually deliver today? Pull your incident history for the last six months and calculate your real availability. That number is your baseline. Your SLO should be at or slightly above it—not aspirational fiction.
If you've been running at 99.7%, setting an SLO of 99.9% without changing your infrastructure or processes is a commitment you'll break regularly. An SLO you miss every quarter erodes trust faster than a realistic one you occasionally breach.
How to Set Your First SLO
Step 1: Pick the right SLIs
Not every metric makes a good SLI. Good ones are:
- Directly correlated with user experience
- Measurable from your monitoring stack without ambiguity
- Aggregatable over time windows
For a web service, request success rate (non-5xx responses / total requests) and availability (minutes the service responded / total minutes) are the most common starting points.
Step 2: Establish your measurement window
Rolling 28-day windows are standard. They avoid the "month boundary" problem where a single incident wipes out two months of budget simultaneously. 7-day windows surface problems faster but are noisier.
Step 3: Set the target from real data
Take your actual six-month average, then decide: can we realistically improve by 0.1–0.2 percentage points given current investment? That's your SLO. Document the reasoning.
Step 4: Define your SLA conservatively
A common approach: set the SLA 0.3–0.5 percentage points below the SLO. If your SLO is 99.5%, your SLA might be 99.0% or 99.2%. This absorbs the gap between internal accountability and external liability.
Step 5: Decide what burns the budget
Write down explicitly what counts as downtime. Scheduled maintenance windows? Degraded performance but not full outage? Partial region failures? These definitions matter enormously when you're reviewing an incident two weeks later.
Using Your Error Budget
The error budget isn't just an alarm threshold—it's a prioritization tool.
When budget is healthy (>50% remaining): This is when you can take on riskier deploys, run load tests in production, or ship experimental features.
When budget is running low (25–50% remaining): Slow down risky changes. Increase deployment caution. Review any scheduled maintenance.
When budget is nearly exhausted (<10% remaining): Freeze non-critical releases. Focus engineering effort on reliability. This is the moment the error budget does its real job—it forces a conversation between product and engineering without anyone needing to play the blame game.
The budget creates a shared incentive: product wants to ship features, engineering wants stability, and the budget makes the tradeoff concrete and automatic.
Monitoring That Supports Your SLOs
Your SLO is only as credible as your measurement. A few things to get right:
- Monitor from outside your infrastructure. Internal health checks don't catch CDN failures, DNS issues, or routing problems that affect real users. Multi-region external monitoring—checking from multiple geographic locations—gives you a more accurate picture of actual availability as customers experience it.
- Use the same window and aggregation method in your monitoring as in your SLO definition. Inconsistency between your dashboards and your SLO calculations causes confusion during incidents.
- Alert on error budget burn rate, not just threshold breaches. A sudden spike burning 10% of your monthly budget in an hour is more urgent than a slow drift that's been happening for days.
Key Takeaways
- Your SLO should reflect what you can realistically deliver, not what sounds impressive.
- Always set your SLA below your SLO—never equal to it.
- Error budgets are a prioritization mechanism, not just a warning light.
- Define downtime explicitly before an incident happens, not during one.
- Measure availability from outside your own infrastructure for numbers that reflect actual user experience.
- Revisit your SLOs every quarter as your system and team evolve.