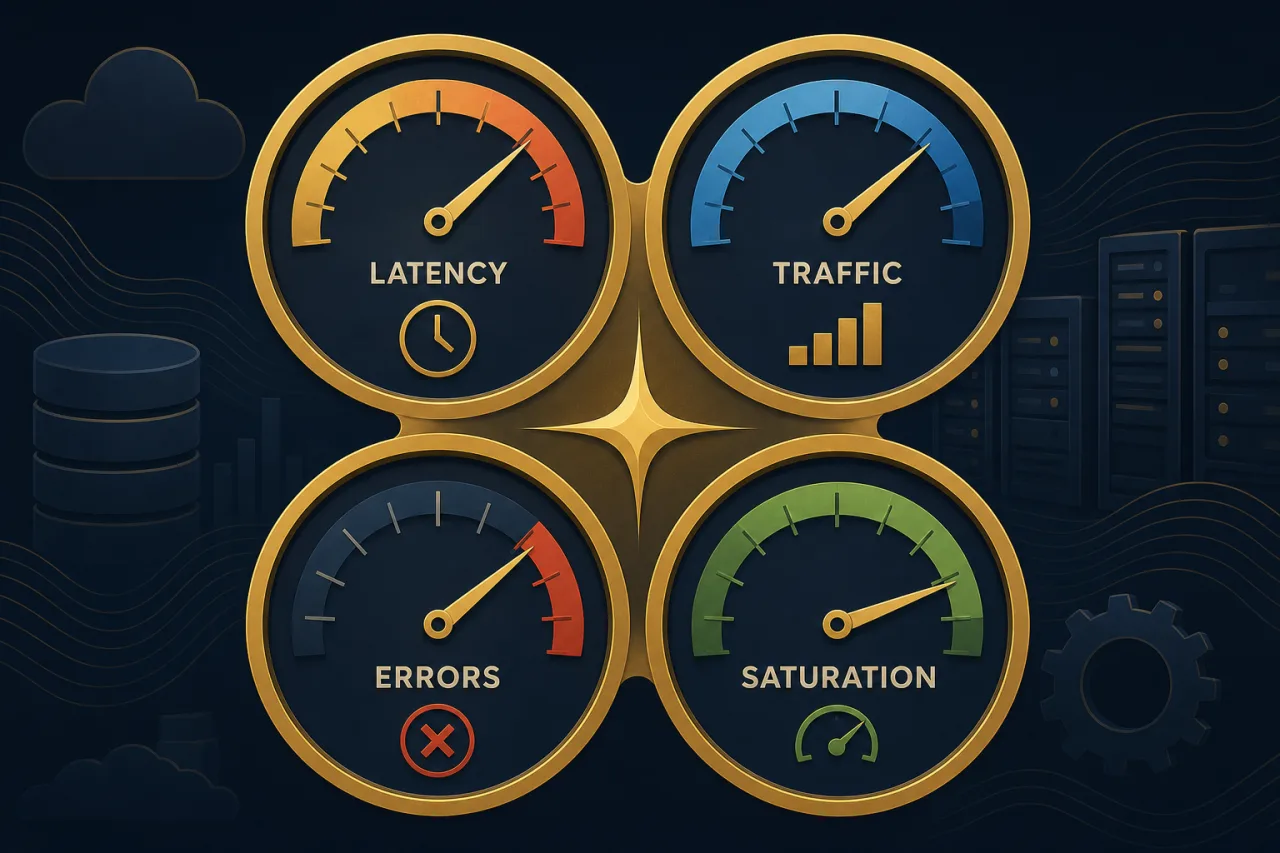
What Are the Four Golden Signals?
The four golden signals come from Google's Site Reliability Engineering book. They're a framework for deciding what to instrument first when you're building observability into a service. The signals are latency, traffic, errors, and saturation. Together they give you a concise picture of service health without requiring you to track dozens of metrics before you know what's wrong.
This isn't theory. It's a prioritization tool. If you only have time to add four dashboards today, these are the four.
1. Latency
Latency measures how long it takes to serve a request. The critical detail most teams miss: track successful and failed requests separately.
A spike in error rate often drops average latency because errors return fast. If you average them together, errors can mask slowdowns in your healthy traffic — and a slow successful request is frequently more damaging to user experience than a fast error.
What to measure:
- p50, p95, and p99 response times (not just averages)
- Latency by endpoint, not just service-wide
- Latency from the client's perspective where possible
Averages lie. A p99 of 4 seconds means 1 in 100 users hits a very bad experience. Percentiles tell the real story.
2. Traffic
Traffic quantifies demand on your system. The right unit depends on your service type:
- HTTP API: requests per second
- Streaming service: active connections or bytes per second
- Background job processor: tasks enqueued or processed per minute
- Database: queries per second or transactions per second
Traffic context is essential for interpreting everything else. A 5% error rate during 10 requests/sec is very different from a 5% error rate during 50,000 requests/sec. Traffic also helps you detect anomalies in both directions — an unexpected spike often means abuse or a retry storm, while a sudden drop can indicate a broken deployment or a routing failure upstream.
3. Errors
Errors measure the rate of requests that fail. This sounds simple, but defining "failure" correctly takes thought.
Explicit vs. implicit errors
Explicit errors are easy: HTTP 500s, uncaught exceptions, gRPC status codes other than OK.
Implicit errors require more work to surface:
- An HTTP 200 that returns an empty result set when records should exist
- A response that's structurally valid JSON but contains an error field your client checks
- A request that succeeds but exceeds your latency SLO
Build your error tracking to capture both types. Alert on error rate, not raw count — a jump from 2 errors/min to 20 errors/min at 3 AM is more alarming than 200 errors/min during your peak hour if that's normal.
4. Saturation
Saturation tells you how full your service is — specifically, how close you are to a resource limit. It's the leading indicator the other three signals miss: a service can look healthy right up until it hits a wall.
Common saturation metrics to track:
- CPU utilization (watch for sustained >80%, not brief spikes)
- Memory usage and swap activity
- Disk I/O wait and disk space
- Thread pool or connection pool exhaustion
- Queue depth for async systems
Saturation is where you catch problems before they affect latency and error rate. A connection pool that's 95% utilized isn't broken yet, but it will be.
Putting It Together
The signals work as a system. Here's a simple diagnostic flow:
- Check traffic — Is demand normal, spiking, or dropped?
- Check error rate — Are requests failing? At what rate?
- Check latency — Are successful requests slow? Which percentile is affected?
- Check saturation — Is any resource approaching its limit?
This order lets you triage fast. If traffic dropped and errors are low, suspect a routing or deployment issue. If traffic is high and saturation is elevated, you may need to scale or shed load.
Where external monitoring fits in
Your internal metrics cover what your systems report about themselves. External uptime monitoring — checking your endpoints from multiple regions — adds the client perspective. It catches cases where your internal metrics look fine but a network issue, DNS failure, or misconfigured CDN is blocking real users. Tools like Pingy run synthetic checks from distributed locations so you see latency and availability the way your users actually experience it, not just how your infrastructure reports it.
Key Takeaways
- Latency: measure percentiles, separate successes from errors
- Traffic: pick the right unit for your service type; watch for both spikes and drops
- Errors: define explicit and implicit failure; alert on rate, not count
- Saturation: the leading indicator — catch resource exhaustion before it causes incidents
- Use the four signals together as a triage sequence, not as isolated dashboards
- Complement internal metrics with external synthetic monitoring to see what users actually experience