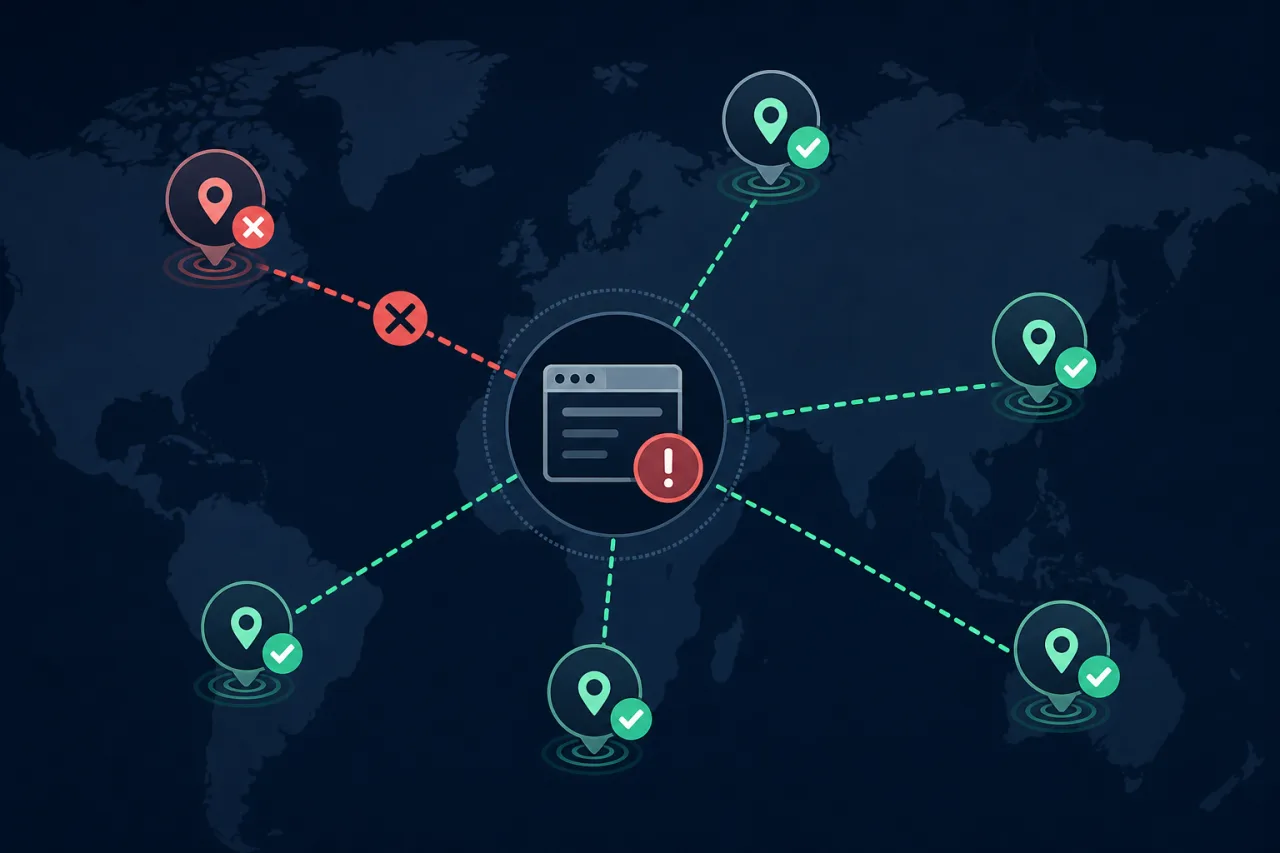
The Problem With Checking From One Place
Most teams start with uptime monitoring the obvious way: pick a monitoring service, set a check interval, and move on. Simple enough — until you get paged at 2 a.m. for an outage that only existed in one AWS region's network path, while your actual users in three continents never noticed a thing.
Or worse: your site is genuinely down for users in Southeast Asia, but your single monitor in Virginia reports green because it can reach your CDN edge node just fine.
Single-location monitoring doesn't measure uptime. It measures reachability from one vantage point. Those are very different things.
What Single-Location Checks Miss
BGP and routing anomalies
The internet is a mesh of autonomous systems exchanging routes via BGP. A routing leak, a misconfigured peer, or a transit provider issue can make your site unreachable from entire regions while remaining perfectly accessible from others. A single monitor in Frankfurt will never surface a blackhole affecting traffic from Tokyo.
CDN and DNS propagation problems
If you use a CDN or GeoDNS, different regions resolve your hostname to different IPs and edge nodes. A misconfigured cache rule, an expired SSL certificate on one edge node, or a failed health-check failover can break users in specific geographies without touching the rest. One monitor catches none of this.
ISP-level outages
Sometimes a major ISP or cloud provider has a partial outage — degraded, not fully down. Your monitor's provider might not be affected at all, so you get no alert while a significant slice of your user base experiences timeouts.
Latency vs. availability confusion
A single check tells you the site responded. It doesn't tell you it responded fast enough. Multi-region checks let you track response time per region, so you can distinguish a real outage from a performance regression that looks like one.
How Multi-Region Monitoring Actually Works
A distributed monitoring system runs your HTTP, TCP, or DNS checks from multiple independent locations — ideally across different cloud providers and continents — and aggregates the results before triggering an alert.
The basic decision logic looks like this:
- All regions report up → Site is healthy.
- One region reports down, others report up → Likely a regional routing or edge issue; alert with regional context.
- Majority of regions report down → Treat as a real outage; page on-call immediately.
- All regions report down → Confirmed global outage; escalate.
This approach eliminates the false positive where a single monitor has a transient network hiccup and screams at your team for nothing. It also surfaces the silent failures that single-location tools miss entirely.
Services like Pingy run checks from multiple geographic nodes so you get that regional breakdown without having to stitch together several separate monitoring accounts yourself.
Setting Up Effective Multi-Region Checks
Here's a practical checklist for getting real value out of distributed monitoring:
- Cover your actual user geography. If 60% of your traffic comes from Europe and Asia, monitoring only from US regions is still blind to half your users. Pick nodes that reflect where your real traffic originates.
- Use at least three regions. Two regions can't break a tie. Three gives you a majority-vote baseline.
- Set per-region alerting thresholds. A single region going down might be worth a Slack notification, not a PagerDuty page. Tune severity by scope.
- Check both your apex domain and key subdomains. Your main site might be fine while
api.yourdomain.comis returning 503s from one CDN pop. - Monitor DNS resolution separately. An HTTP check that fails could be a DNS problem, not an application problem. Knowing which one saves significant debugging time.
- Track response time per region. Set a latency threshold — not just a pass/fail — so a 10-second response from Sydney triggers an alert even when the status code is 200.
- Test your SSL certificate expiry from multiple nodes. Certificate issuers and CDN edge certificates can expire on different schedules.
Reading the Regional Data
When an alert fires, the first question is scope: is this everywhere, or just one region? That single data point cuts your diagnosis time dramatically.
- One region affected → Start with your CDN config, DNS routing policy, and any recent deploys that changed edge behavior.
- Multiple regions affected → Look at your origin: load balancer health, database connectivity, application errors at the infrastructure layer.
- All regions affected → Your origin is down or your DNS is broken globally. Check nameservers first, then your origin.
Without multi-region data, you're doing this diagnostic work blind.
Key Takeaways
- A single monitoring location measures reachability from one network path, not actual uptime.
- BGP anomalies, CDN misconfigurations, and ISP outages can affect specific regions while leaving your monitor's network untouched.
- Multi-region checks with majority-vote alerting reduce false positives and surface real regional failures.
- Use at least three geographically distributed nodes that reflect your actual user traffic.
- Regional breakdown at alert time dramatically shortens time-to-diagnose.