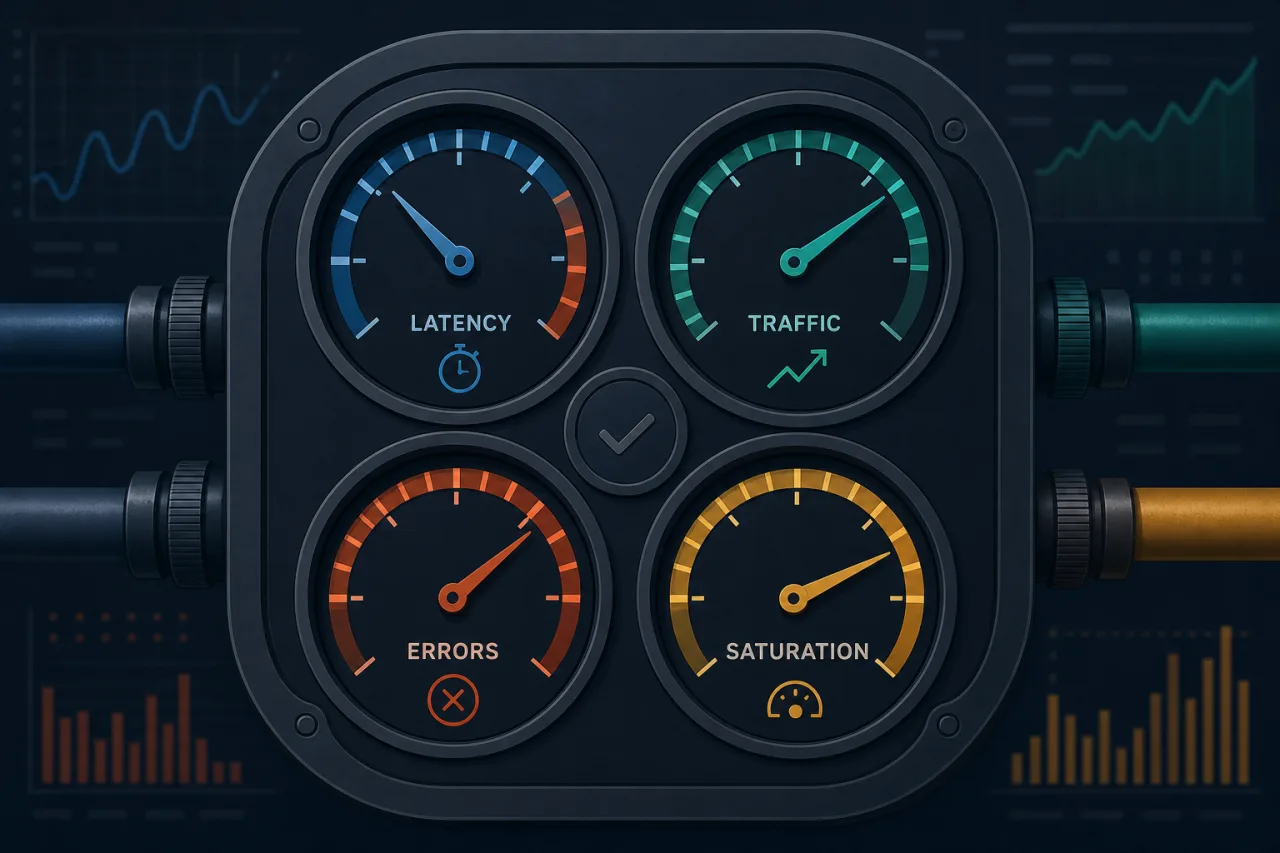
The Four Golden Signals of Monitoring
Google's Site Reliability Engineering book introduced the concept of the four golden signals as a minimal, high-signal set of metrics for monitoring any user-facing system. If you can only measure four things, measure these. If you measure more, make sure these four are covered first.
The signals are: latency, traffic, errors, and saturation.
1. Latency
Latency measures how long it takes to serve a request. It sounds simple, but there's an important nuance: track successful and failed requests separately.
A request that fails fast — say, a 500 returned in 2ms — will drag your average latency down and mask real performance problems. A request that fails slowly is even worse: it ties up connections and degrades user experience.
What to track
- p50, p95, p99 latency — averages hide tail latency problems; percentiles don't
- Latency broken out by endpoint or service, not just a single global number
- Latency for failed requests logged separately from successful ones
A page that loads in 200ms in your primary region may load in 900ms for users in Southeast Asia. Multi-region synthetic checks can surface this — latency is not a single number.
2. Traffic
Traffic measures the demand on your system. Depending on your stack, this might be:
- HTTP requests per second
- Database queries per second
- Messages consumed from a queue
- Active WebSocket connections
Traffic is the context signal. A spike in errors means something very different during 10 req/s versus 10,000 req/s. Without traffic data, you're debugging blind.
Practical tip
Correlate traffic with your deployment timeline. A drop in traffic after a deploy is often a canary for a broken endpoint — users hit an error, give up, and stop retrying. That pattern won't show up as a loud alert; it shows up as a quiet, suspicious dip.
3. Errors
Errors measure the rate of requests that fail. "Fail" means different things in different contexts:
- Explicit failures: HTTP 5xx responses, thrown exceptions, database timeouts
- Implicit failures: an HTTP 200 that returns an empty dataset when it shouldn't, or a response missing a required field
- Policy failures: requests that succeed but violate an SLO — e.g., correct response but took 8 seconds
What to instrument
- Count errors by type and endpoint, not just as a global rate
- Set alert thresholds on error rate (errors/total requests), not raw error count — raw counts are noisy during traffic spikes
- Log enough context on each error to debug without reproducing: request ID, user agent, region, relevant headers
External uptime monitoring adds a layer here that internal metrics miss. Your internal error rate might look fine while a misconfigured CDN or a DNS propagation issue is returning errors to real users. Running checks from multiple external locations catches the gap between "our servers are healthy" and "users can actually reach us."
4. Saturation
Saturation measures how full your system is. It's a forward-looking signal — it tells you how close you are to the limit before things break.
Saturation is resource-specific:
- CPU: sustained high utilization, not momentary spikes
- Memory: available headroom, swap usage
- Disk: free space, but also I/O wait and queue depth
- Connections: database connection pool utilization, open file descriptors
- Network: bandwidth utilization on ingress/egress
Why saturation matters
Most systems degrade before they fail. A database connection pool at 95% capacity will start queuing requests and increasing latency before it starts returning errors. Saturation gives you the warning window to act.
Set alerts at a threshold that gives you time to respond — not at 100%. A common pattern is to alert at 80% and page at 90%.
Putting It Together
The four signals work as a system. A useful debugging sequence:
- Error rate spikes → check if traffic also spiked (load-related?) or stayed flat (regression?)
- Latency increases → check saturation metrics to see if a resource is under pressure
- Traffic drops unexpectedly → check errors; users may be silently failing and not retrying
- Saturation climbs → check traffic trends; is this organic growth hitting a ceiling?
None of the signals are useful in isolation. Build dashboards that show all four together, and write runbooks that tie alert conditions to this reasoning chain.
Key Takeaways
- The four golden signals — latency, traffic, errors, saturation — are the minimum viable monitoring surface for any production service
- Track latency as percentiles, not averages; separate successful and failed request latency
- Error rate is more actionable than raw error count
- Saturation is a leading indicator — it warns you before failures occur
- External monitoring complements internal metrics; your servers being healthy doesn't mean users can reach them
- Correlate all four signals together; the pattern across signals tells you more than any single metric alone