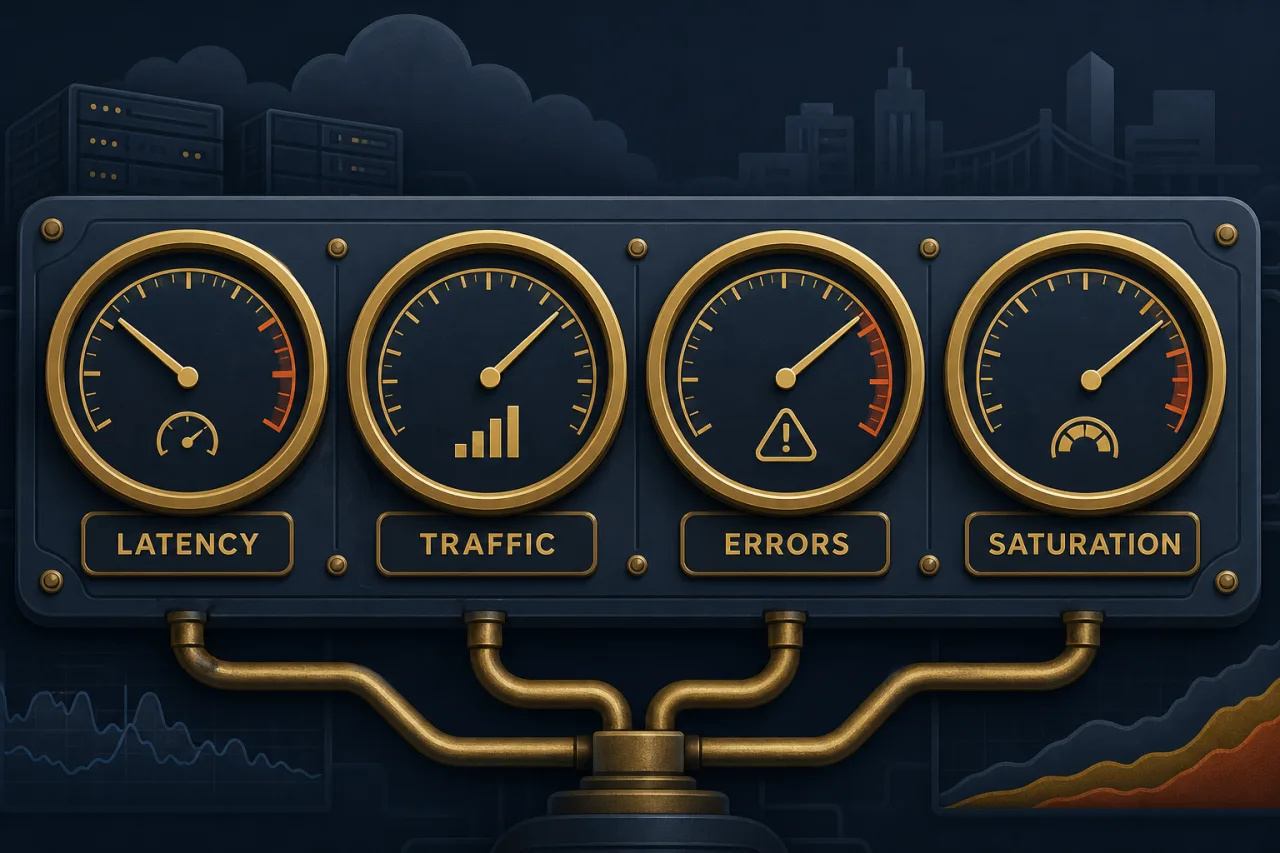
What Are the Four Golden Signals?
In the Google SRE book, the authors distill production monitoring down to four signals that, if you measure nothing else, give you a meaningful picture of system health. They are: latency, traffic, errors, and saturation.
This isn't a framework you adopt wholesale and call done. It's a mental model for deciding what to instrument first and what to alert on before you have unlimited time to build out a full observability stack.
1. Latency
Latency is how long it takes to serve a request. The critical nuance: track successful and failed requests separately.
A spike in errors can artificially deflate your latency numbers because failed requests often return fast (a 500 from a dead database connection is nearly instantaneous). If you average those in, your p99 looks fine while users are experiencing real pain.
What to measure:
- p50, p95, and p99 response times — not just averages
- Latency by endpoint or service, not just globally
- Latency of downstream dependencies (databases, third-party APIs)
A useful rule of thumb: if your p99 is climbing while your p50 stays flat, a subset of requests is getting stuck — often a sign of a slow query, a lock contention issue, or a saturated upstream.
2. Traffic
Traffic measures demand on your system. For a web service this is typically requests per second. For a message queue it might be messages consumed per second. For a data pipeline, bytes processed.
Traffic on its own rarely triggers an alert, but it provides essential context for every other signal. An error rate of 2% at 10 req/s is very different from 2% at 50,000 req/s.
Traffic also helps you:
- Detect traffic drops that signal upstream failures or misconfigured routing
- Correlate load with latency increases to find your saturation point
- Establish baselines for capacity planning
A sudden drop to near-zero traffic is often a worse sign than a spike. External uptime monitoring — checking your endpoints from multiple regions — will catch this faster than an internal metric that stops emitting when the service is down.
3. Errors
Errors are the rate of requests that fail. This includes explicit failures (HTTP 5xx responses, exceptions) and implicit ones — an HTTP 200 that returns an empty body when it shouldn't, or a response that exceeds an agreed SLA.
Three categories worth tracking:
- Explicit errors — HTTP 5xx, gRPC error codes, unhandled exceptions
- Implicit errors — malformed responses, missing required fields, wrong content type
- Policy errors — successful responses that still violate an SLO (e.g., correct data returned in 4 seconds when your SLO is 1 second)
Don't just alert on raw error counts. Alert on error rate (errors / total requests) so the signal is proportional to traffic volume. A fixed threshold of "more than 50 errors" is meaningless without knowing how much traffic you're serving.
4. Saturation
Saturation describes how full your service is. It's a measure of the constrained resource — the one that will break first.
For most services that's one of:
- CPU utilization
- Memory usage
- Disk I/O or disk space
- Network bandwidth
- Thread pool or connection pool exhaustion
- Database connection limits
Saturation is the most predictive of the four signals. Latency and errors tell you something is already wrong. Saturation often tells you something will go wrong before it does.
A practical approach: identify the top one or two constrained resources for each service in your stack. For a Node.js API, that's probably event loop lag and open file descriptors. For Postgres, it's connection count and replication lag. Instrument those specifically rather than collecting everything.
Putting It Together
The four signals work best as a layered diagnostic tool:
- Traffic anomaly detected — is this a real load increase or did something break upstream?
- Latency climbing — are errors masking it? Is a dependency slow?
- Error rate rising — are errors explicit (5xx) or implicit? Which endpoints?
- Saturation high — what resource is the bottleneck? Is this trending toward a limit?
You don't need a sophisticated platform to start. Prometheus with Grafana covers all four signals for most stacks. Add external monitoring (hitting your actual URLs from outside your network) to catch the cases your internal metrics miss — like the load balancer that's up but routing to a dead backend, or the CDN misconfiguration that breaks requests from a specific region.
Key Takeaways
- The four golden signals are latency, traffic, errors, and saturation — instrument these before anything else
- Always separate error latency from success latency or your numbers will mislead you
- Alert on error rate, not raw error count
- Saturation is the most predictive signal — it warns you before users are impacted
- Internal metrics go dark when your service is down; external uptime checks catch what your dashboards can't
- Use traffic as context for every other signal, not as a standalone alert